The Overview tab shows whether a webinar is working and where it’s losing people. Use it to find the next thing worth fixing: more sign-ups, better show-up, keeping people until the offer, or more clicks.
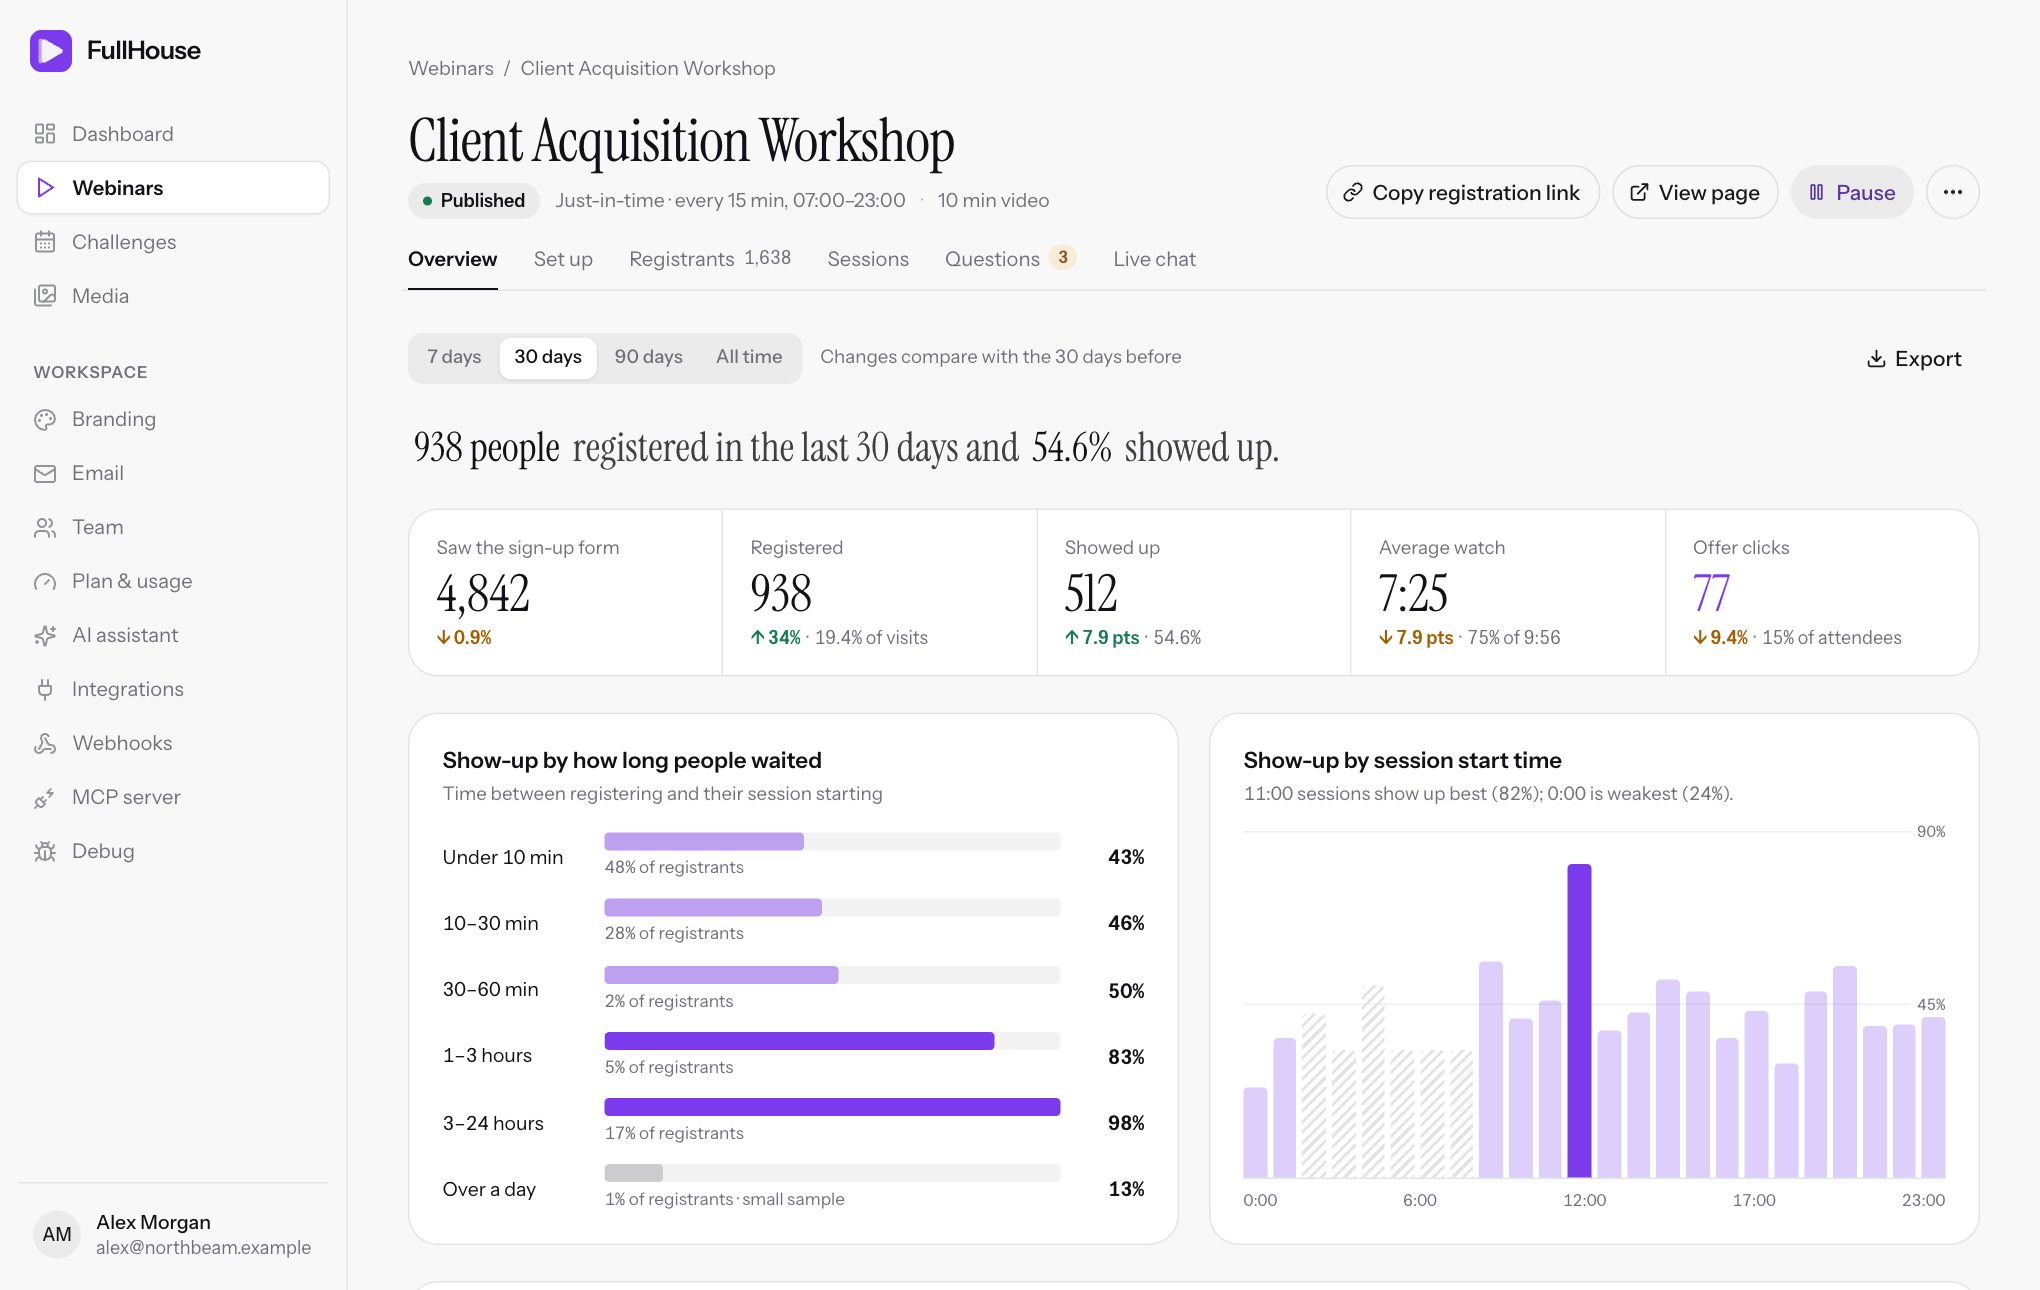
Open it from Webinars → your webinar → Overview. For numbers across all your webinars, see the dashboard.
Choose a period
Pick 7 days, 30 days, 90 days or All time at the top. It starts on 30 days. With a number of days chosen, changes compare with the same number of days before, and the page says so. All time has nothing to compare with, so its comparisons disappear.
The period is about when people registered, not when their session ran. Showing up and clicking are then counted for those same people, whenever their session happened.
| Item | How the period applies |
|---|---|
| Saw the sign-up form | Visits during the period |
| Registered, Showed up, Average watch, Offer clicks | People who registered during the period |
| Both show-up charts | People who registered during the period, and whose session has finished |
| Sources | People who registered during the period |
| Poll answers and Feedback ratings | Submitted during the period |
| Who keeps watching | Not affected. It always covers every live session the webinar has ever run. |
| Export files | Not affected. They always contain everything. |
The summary sentence
The sentence at the top puts the main result in words, for example:
240 people registered in the last 30 days and 41.7% showed up. People who got a session
within 10 minutes showed up 58% of the time; those who waited over an hour, 29%.
The first part only mentions show-up once at least one of their sessions has finished. The wait comparison only appears when both groups have at least 10 people and the shorter wait is ahead by at least 5 points. With no registrations you’ll see Nobody has registered in the last 30 days yet, plus how many people have seen the form.
Key numbers
| Number | Definition | Beneath it |
|---|---|---|
| Saw the sign-up form | How many times your registration page or an embedded form was opened. This counts page opens, not unique people, so reloads count again. Preview visits aren’t counted. | Change from the previous period |
| Registered | People who signed up, through any route. | Change, and the share of visits, such as 12% of visits |
| Showed up | Of those people, how many joined the live session. | Change in points, and show-up rate |
| Average watch | Average time played live, for those who joined. Time past the video’s length isn’t counted. | Change in points, and the share of the video, such as 43% of 58:00 |
| Offer clicks | Of those people, how many clicked an offer in the live session. A person counts once, however many clicks. | Change, share of attendees, and +N on replays for people who only clicked on the replay |
Changes show an arrow with % for counts and pts (percentage points) for rates. A blank means there’s nothing to compare with.
How show-up is worked out
Show-up rate is Showed up divided by Registered.
Someone has shown up once the room has recorded them during the live session. Opening the waiting room and leaving before the start doesn’t count, and a replay doesn’t count. Staying for a moment after the start does.
How watch time is measured
The room checks in about every 20 seconds while someone is in it, and adds the time since the last check-in only if the video was actually playing and moving forward. Paused time and closed tabs don’t add anything. Joining late means less watch time, so someone who joins halfway and stays to the end has watched about 50%.
Show-up by how long people waited
This chart compares show-up for different gaps between registering and the session starting. Only sessions that have finished and weren’t canceled count, so it fills in over time: This fills in once sessions people registered for have finished.
| Group | Time between registering and starting |
|---|---|
| Under 10 min | Less than 10 minutes |
| 10–30 min | 10 to 30 minutes |
| 30–60 min | 30 to 60 minutes |
| 1–3 hours | 1 to 3 hours |
| 3–24 hours | 3 to 24 hours |
| Over a day | 24 hours or more |
Each row shows the show-up rate, plus that group’s share of registrants. Groups with no one are hidden. A group with fewer than 10 people is grey and marked small sample, because a few people can swing it a long way.
When a shorter wait clearly wins, a tip may appear with a link:
- If you use just-in-time sessions and offer more than one time:
You show 3 times to pick from. Offering only the next one or two pushes more people into the shortest wait.Edit schedule takes you to that step. - Otherwise:
People who book days ahead drift away. A reminder an hour before, and another 15 minutes before, keeps them coming.Edit reminders takes you to Reminder emails.
Show-up by session start time
This chart shows which start times get people to turn up, using the same finished sessions. Times are in the time zone of your first active schedule rule, or the webinar’s own time zone if there isn’t one. Times that aren’t used are left out of the ends of the chart.
Times with fewer than 10 registrants are hatched and left out of the comparison. The description names the strongest and weakest, such as 7:00 PM sessions show up best (48%); 9:00 AM is weakest (27%). Hover over a bar for the numbers.
Until a time has 10 registrants you’ll see Needs at least 10 registrants in a time slot before it is worth comparing.
Who keeps watching
This chart shows retention through the video. The bottom axis is the video’s timeline, and the height is how many people are watching as a share of the busiest minute. 100% is your peak minute, not everyone who registered.
- Counted across every live session ever, whichever period you’ve chosen, because it’s a running total for each minute of the video. Replays aren’t included.
- Someone is counted for a minute when they reach it with the video playing. People who join late only count from the minute they joined, so the line can rise early on while latecomers arrive.
- Your timeline is overlaid: shaded bands for
Offer on screenandPoll, and a dashed line forHandout. These show your active items as they are now, so if you’ve moved an offer since, the band won’t match older viewing. - The biggest drop is marked, such as
−8% at 32:00. A drop is the share of viewers lost from one minute to the next. It must be at least 3% to be marked, and the first and last minutes are ignored. - Hover to read off any minute:
At 32:00, 61% are still watching (146 people across all sessions).
Look at what’s on screen right before a big drop. If people leave as your offer appears, work on the lead-in rather than the offer. If a large share has already gone before the offer, consider moving it earlier.
Until people have watched, you’ll see This appears once people have watched a live session.
Sources
This table shows where sign-ups came from, using each person’s utm_source. People with none show as direct. The six largest sources appear. See how to add UTM values.
| Column | Definition |
|---|---|
| Reg. | People from this source who registered during the period |
| Show-up | How many of them joined live, as a percentage |
| Clicks | How many of them clicked an offer, live or on the replay |
The best Show-up figure is highlighted when at least two sources have 10 or more registrants. Compare this with your ad costs, because the cheapest registrations aren’t always the ones that turn up.
Poll
This card shows answers to each poll, starting with the one with the most answers. If you have several, use the arrows to move between them. The figures are real answers only, without the starting votes attendees see, so percentages here can differ from those in the room. Polls you’ve turned off stay in this list.
If you have no polls: Add a poll to the room timeline to see answers here.
Feedback
This card shows the average rating out of 5, how many ratings it’s based on, a bar of how they’re split, and the 3 latest written comments.
Feedback comes from a form shown after the session to people who watched some of it, live or on replay. See what attendees see. Each person can rate once.
Until there are ratings: Ratings from the end-of-session feedback form show up here.
Export
Export at the top downloads Registrants (CSV), Poll answers (CSV) or Feedback (CSV). Each file covers all time and ignores the period you’ve chosen. See the exact columns. To export a filtered list of people, use the Export CSV button on Registrants.
Reading the funnel
| What you see | Look at |
|---|---|
| Few visits | Your traffic, and your UTM sources |
| Plenty of visits, few registrations | Your registration page headline and the session times on offer |
| Registered is fine, show-up is low | Reminder emails, and shorter waits with just-in-time sessions |
| Show-up is fine, watch time is low | The retention chart, and your video’s opening |
| People stay, but few click | The offer itself, its timing and its wording |
| Attendees leave before the offer | Bring the offer forward, or tighten the section before it |